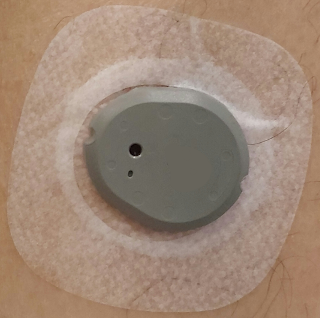
Have you ever wondered why your Continuous Glucose Monitor (CGM) and Blood Glucose Monitor (BGM) seem to give slightly different readings?
The Problem: Why Do These Devices Disagree?
Both CGMs and BGMs have some level of error in their measurements. Manufacturers often provide accuracy percentages to help users understand this. For example, a CGM might claim to be accurate within 8.5%, while a BGM could have an accuracy rate of 15%. These percentages mean that the devices can be off by that much from the actual blood glucose level.
However, if you assume that one device is reading at the highest possible value of its error range and the other at the lowest, you might think the difference between the two readings could be huge. Yet, in real life, users often report that the numbers are closer than expected—sometimes differing by only 5%. So why is the real-world experience so much better than the theoretical extremes?
Let’s take a closer look with a bit of math.
The Math: Finding the Real Discrepancy
Manufacturers usually advertise the maximum error range, but in practice, these errors don’t always need to occur at their worst levels. Instead, the devices could perform more reliably, leading to smaller discrepancies.
Imagine you’re looking at a CGM with an 8.5% error and a BGM with a 15% error. When both devices are calibrated and used in real-world conditions, these error percentages give us a combined potential error for both devices. The key here is to understand how these errors interact.
I asked my friend who helped me out with the math a bit. Rather than just adding them up, we can use a technique from statistics called root mean square error (RMS). It helps us estimate the combined effect of these errors when they’re not always acting in the worst possible way. The formula is:
Ecombined = √{(ECGM)2 + (EBGM)2}
This means that, in theory, the maximum combined error could be as high as 17.25%. But remember, this is only the worst-case scenario.
Real-World Discrepancies: Why Do They Seem Lower?
In practice, you may notice that your readings from the CGM and BGM differ by far less than this combined error. Instead of seeing huge differences, you might see discrepancies of around 5%, which is a lot tighter than the 17% we just calculated.
To understand why this happens, let’s assume the real-world errors for both devices are smaller than the advertised extremes. If your CGM is performing better than expected, say with an effective error of 2.46%, and your BGM is similarly more accurate with an effective error of 4.34%, the observed discrepancy will shrink.
When these lower error rates are plugged into the same formula, the combined error becomes closer to what you actually observe—around 5%. This reflects the real-world behavior of the devices, where both are more precise during stable glucose periods, reducing the gap between their readings.
The Solution: What Can You Expect?
So, what’s the takeaway? While manufacturers provide maximum error ranges to be cautious, your real-world experience with these devices is usually more consistent. Rather than facing a 17% discrepancy, you’re likely to see much smaller differences, especially during stable glucose levels.
Knowing this can bring some peace of mind when using both a CGM and a BGM. If your readings are close—within 5%—that’s a sign that both devices are functioning well. And if you do see larger discrepancies, it’s a reminder that the devices operate within a known margin of error, and it’s not always cause for concern.
In Conclusion
Understanding the science and math behind blood glucose monitors can help us better interpret the data we see every day. So, whether your CGM and BGM readings are best friends or frenemies, what’s been your experience? Let’s see if your glucose monitors can agree more often than your favorite sitcom characters!
Sometimes, all it takes is a little math to make sense of it all!


